
 predicts gynecological cancer: an 8-year follow-up study of 653 women")
Cancer incidence during the observation period
During follow-up, 62 patients (9.5%) developed cancer. Among them, 36 women had gynecological cancers (uterine, breast and ovarian cancer). The most common cancer types were uterine (n = 16), breast (n = 11), thyroid (n = 10), and ovarian (n = 9). Six patients developed colorectal cancer, four patients developed gastric cancer, two patients were diagnosed with melanoma, and single cases of hepatocellular carcinoma, pancreatic cancer, and acute myeloid leukemia were recorded. One patient mentioned only an attack of cancer without specifying the type. None of them had known genetic mutations linked to cancer. Figure 1 shows the timeline of new cancer occurrence during follow-up.
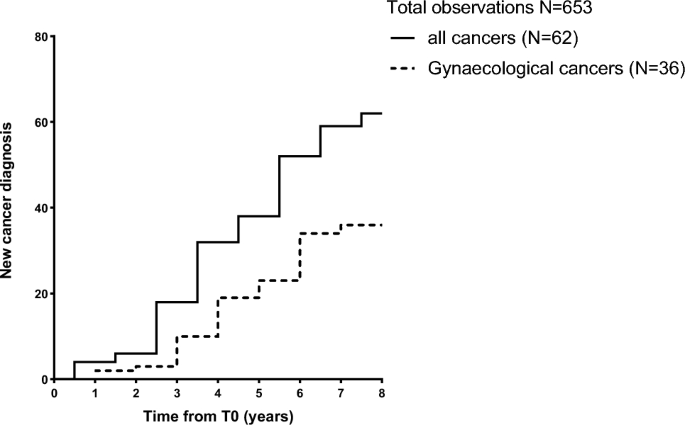
New cancer diagnosis during follow-up. New cancer cases were recorded during the 8-year follow-up period. Patients were first evaluated from January 2014 to December 2017. Follow-up will be conducted annually by telephone or clinical assessment according to the clinical situation and institutional policy of the patient’s condition and will end in December 2022.
Clinical characteristics of the study population
Baseline characteristics of the 653 female patients are shown in Table 1 . The mean age of our cohort was 55.2 ± 0.6 years. Interestingly, most of our patients had metabolic disorders, as 513 patients (79%) had waist circumference (WC) values above the cutoff of 80 cm (diagnostic criteria for metabolic syndrome), with a mean WC value of 94.7 ± 0.6 cm. This feature was also confirmed when body mass index (BMI) was taken into account (mean 26.8 ± 0.3), as 334 (51%) patients were overweight and 170 (26%) patients were obese.
Clinical characteristics of the cancer population and comparison with non-cancer groups
When comparing biofluid and clinical parameters between patients with cancer and women without cancer (Table 2), no significant differences were found at baseline except for AST levels (36.8 ± 2.5 U/I). and 21.9 ± 8.2 U/I, p-value (p < 0.001).
Therefore, we compared AARPRI, APRI, FIB-4, and mFIB-4 between women with developing and non-developing cancer. We found a significant increase in AARPRI (0.5 ± 0.3 and 0.9 ± 0.6, p < 0.001) among patients who developed cancer during follow-up (Fig. 2A), and APRI (0.3 ± 0.1) and 0.5 ± 0.3, p < 0.001, Figure 2B), FIB-4 (1.0 ± 0.6 and 1.8 ± 1.3, p < 0.001, Figure 2C) and mFIB-4 (2.0 ± 1.3 and 3.4 ± 2.6, p < 0.001, Figure 2D).These data emphasize bona fide The predictive power of these scores and the impact of NAFLD-related metabolic abnormalities on cancer development.
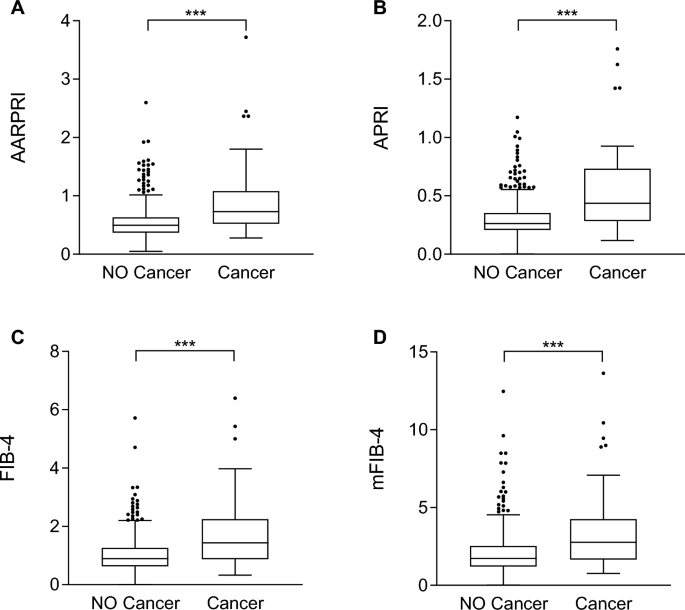
Noninvasive liver fibrosis scores were compared between women who developed cancer and those who did not develop cancer during follow-up. Comparison between AARPRI (arrive), Asia-Pacific Policy Institute (Second), FIB-4 (C), mFIB-4 (d) values in patients who developed cancer (n = 62) and those who did not develop cancer (n = 591) during follow-up. Statistical significance was assessed by the Mann-Whitney U test, with p < 0.05 considered significant (***p < 0.001). Boxplots show the median (second quartile), first and third quartiles, and Tukey whiskers represent 1.5 times the interquartile range or to the highest or lowest point, whichever is shorter. shall prevail). Any data outside of these whiskeys is shown as points. AST, aspartate aminotransferase; AARPRI, (AST to ALT ratio) to platelet ratio index; APRI, AST-platelet ratio index; FIB-4, fibrosis-4 index; mFIB-4, modified FIB-4.
Non-invasive liver fibrosis score distinguishes women with specific types of cancer
As some non-invasive scores of liver fibrosis have shown stronger correlations with specific types of cancer8, and given that in our cohort these scores could differentiate among those who developed cancer, we then performed multiple comparisons among women with the most typical cancer types (uterine, breast, thyroid, and ovarian cancer). Interestingly, we observed that, unlike other clinical and biofluid parameters, only AARPRI, APRI, FIB-4 and mFIB-4 were significantly different among these subgroups (p < 0.001) (Table 3). Furthermore, when comparing a single cancer subgroup with women without cancer, we found that all of these scores were significantly higher in cancer patients, further supporting the use of these indices in cancer prediction and the involvement of NAFLD in its pathogenesis.
Non-invasive scoring predicts gynecological cancer
Given the interesting theories regarding the complex effects of sex and sex hormones on NAFLD in humans9We then considered only gynecological cancers (uterine, breast, and ovarian cancers) to investigate whether their risk is increased in the context of fatty liver disease. Therefore, we performed receiver operating characteristic (ROC) curve and cutoff analysis of non-invasive liver fibrosis index to predict sex-specific female cancers.
As shown in Figure 3A , overall, AARPRI = 0.7 showed the best Youden index (sensitivity 0.64, specificity 0.79) and larger area under the curve (AUC) (0.75, p < 0.001). FIB-4 (Fig. 3B) also showed a good Youden index (calculated cutoff value of 1.1, sensitivity 0.84, specificity 0.57) and satisfactory AUC (0.74, p < 0.001). Similarly, despite lower AUC and Youden index, APRI (Fig. 3C) and mFIB-4 (Fig. 3D) ROC predicted female cancers.
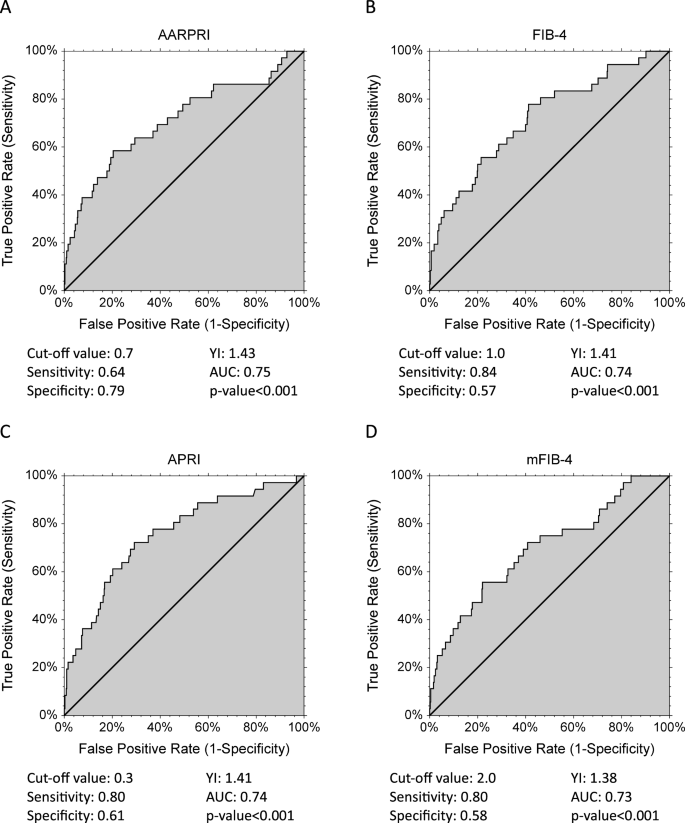
ROC reports gynecological (uterine cancer, breast cancer, ovarian cancer) discrimination. Cutoff values with associated sensitivity and specificity levels and empirical estimates of the area under the curve (AUC) are shown below each AARPRI figure (arrive), FIB-4 (Second), Asia-Pacific Policy Institute (C) and mFIB-4 (d). YI, Youden index; AARPRI, (AST to ALT ratio) to platelet ratio index; FIB-4, fibrosis-4 index; APRI, AST-platelet ratio index; mFIB-4, modified FIB-4.
Non-invasive liver fibrosis score as a risk predictor for gynecological cancers
Since all considered scores ultimately distinguish women with female-specific cancers from women without any type of cancer, we calculated the associated odds ratios (OR) for gynecological cancers using the cutoff value calculated by the ROC as the discriminant ( Figure 4) ).
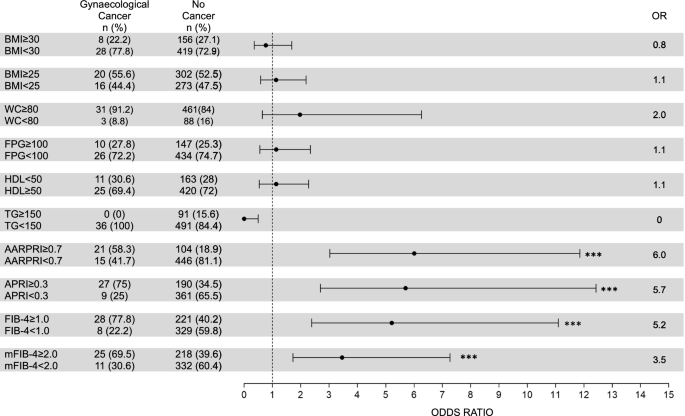
Risk of gynecological cancers (uterine, breast, ovarian). For WC, FPG, HDL, and TG, we considered cutoff values for the diagnosis of metabolic syndrome IDF. For AARPRI, APRI, FIB-4 and mFIB-4, we considered the cutoff values calculated in the ROC analysis (see Figure 3). Each row shows a contingency table used to evaluate odds ratios (OR) and detect the association between a single metabolic abnormality and the development of gynecological cancer. For each variable, an OR representation with a 95% confidence interval is provided. (***) indicates p < 0.001. BMI, body mass index; WC, waist circumference; FPG, fasting blood glucose; TG, triglycerides; AARPRI, (AST to ALT ratio) to platelet ratio index; APRI, AST-platelet ratio index; FIB-4, fibrosis-4 Index; mFIB-4, modified FIB-4.
Among patients with female cancer, 21 (58.3%) had an AARPRI ≥ 0.7, whereas 446 (81.1%) patients without cancer had an AARPRI < 0.7. Therefore, the associated OR for AARPRI was 6 (p < 0.001). Among women with cancer, 27 (75%) had an APRI ≥ 0.3, whereas 361 (65.5%) without cancer had an APRI < 0.3, with an associated OR of APRI of 5.7 (p < 0.001). FIB-4 showed an associated OR of 5.2 (p < 0.001), as 28 (77.8%) cancer patients and 221 (40.2%) non-cancer patients had FIB-4 ≥ 1. Regarding mFIB-4, the associated OR was 3.5 (p < 0.001).
To compare the association of non-invasive liver fibrosis score and other conventional metabolic parameters with cancer development in women, we also calculated ORs for increased BMI (overweight and obesity), WC, fasting plasma glucose (FPG), and triglycerides (TG) : and lowering HDL cholesterol levels using IDF MetS cutoff criteria. Either one was significantly associated with cancer development, as only 8 (22.2%) women in the cancer group had a BMI ≥ 30 (OR = 0.8, p = ns) and 20 (55.6%) women in the cancer group had a BMI ≥ 25 302 (52.5%) non-cancer women (OR = 1.1, p = ns). The prevalence of increased WC was similar in both groups (91.2% in the cancer group and 84% in the non-cancer group), with an associated OR of 2 (p = ns). Regarding the biofluid parameters, similar ORs were detected, but no significant p-values (FPG OR = 1.1, HDL OR = 1.1, TG OR = 0).
Validation of the non-invasive liver fibrosis score as a non-gynecological cancer risk predictor
Since for the liver fibrosis index we used cutoffs based on only groups of women with sex-specific cancers, to ultimately validate the cutoffs for our liver fibrosis score, we evaluated the ORs and analyzed their correlation with other diseases intensity cancer type (Figure 5).

Risk of nongynecological cancers. For WC, FPG, HDL, and TG, we considered cutoff values for the diagnosis of metabolic syndrome in IDF. For AARPRI, APRI, FIB-4 and mFIB-4, we considered the cutoff values calculated in the ROC analysis (see Figure 3). Each row shows a contingency table used to estimate odds ratios (OR) and detect the association between a single metabolic abnormality and the development of nongynecological cancers. For each variable, an OR representation with a 95% confidence interval is provided.
Indicates p < 0.05, (**) p < 0.01, (***) p value < 0.001. BMI, body mass index; WC, waist circumference; FPG, fasting blood glucose; TG, triglycerides; AARPRI, (AST to ALT ratio) to platelet ratio index; APRI, AST-platelet ratio index; FIB-4, fibrosis-4 Index; mFIB-4, modified FIB-4.
Again, unlike increasing BMI (OR = 0.8 BMI ≥ 30 and 0.9 BMI ≥ 25, p = ns), WC (OR = 0.8, p = ns), FPG (OR = 0.9, p = ns), TG (OR = 0.7, p = ns) and reduced HDL (OR = 1.6, p = ns), non-invasive liver fibrosis score showed a significant association with cancer development. APRI ≥ 0.3 was significantly associated with increased tumor risk (OR = 3, p < 0.01), and FIB-4 (OR = 2.8) and mFIB-4 (OR = 2.9) were significantly associated with p < 0.05. AARPRI showed the best OR value (5.00) and the most significant association (p < 0.001), further confirming our study. Source link